Introducing the Salesforce Web Console (Beta): Your New In-Context Troubleshooting Companion
Published 02/05/2026
If you’ve ever tried to debug a failing batch job in the legacy Developer Console, you know the pain. The UI feels like it hasn’t been updated in a decade, logs regularly fail to load or truncate without warning, and the moment you need to cross-reference a SOQL result with the Apex source, you’re juggling multiple browser tabs, a VS Code window, and your sanity. I’ve lost count of the number of times I’ve had a Developer Console tab silently disconnect, losing the log I was halfway through reading or come back to the console to find my script gone. If you want a broader foundation for that workflow, SOQL in Apex and Apex fundamentals are the two guides I usually point people to first.
That is exactly why the Salesforce Web Console (Beta), introduced in April 2026, immediately caught my attention. It’s a modern, browser based IDE embedded directly into Salesforce, designed to bridge the gap between the legacy Developer Console and more robust, project-oriented IDEs like VS Code or Agentforce Vibes. Its primary focus is delivering an in-context troubleshooting experience that reduces the constant tool switching friction I’ve battled for years.
💡 The Philosophy: “Code Where You Build”
Section titled “💡 The Philosophy: “Code Where You Build””The core principle behind Web Console aligns perfectly with how I’ve always wanted to work: stay where the problem is. Instead of opening a separate editor and hunting for the right file or log, you launch Web Console from the same surfaces where issues appear, such as Setup or specific job and metadata pages. This embedded, context-aware model lets you start from the problem itself (an erroring Apex job, a slow query, or a failing transaction) and stay in one connected environment from investigation through fix and validation.
Salesforce describes this as “code where you build”: Web Console brings modern editing, logging, and data tools directly into the platform so that runtime evidence, source code, and validation steps live side by side. In practice, the emphasis is less on full-featured application development and more on shortening the loop between “something broke” and “I found it, fixed it, and verified it.” As someone who spends a significant chunk of my week on exactly this kind of maintenance and troubleshooting work, that resonates deeply.
🔧 Key Features of the Web Console (Beta)
Section titled “🔧 Key Features of the Web Console (Beta)”The initial beta intentionally focuses on the workflows developers and admins use most when they need to investigate and fix issues quickly. Rather than trying to replace a full IDE, Web Console brings together a curated set of capabilities in a unified, browser-based workspace:
-
Debug log viewing
Web Console provides a dedicated logs experience, allowing you to capture, filter, and inspect Apex execution logs directly in the browser, with controls to enable or adjust trace flags for the current user.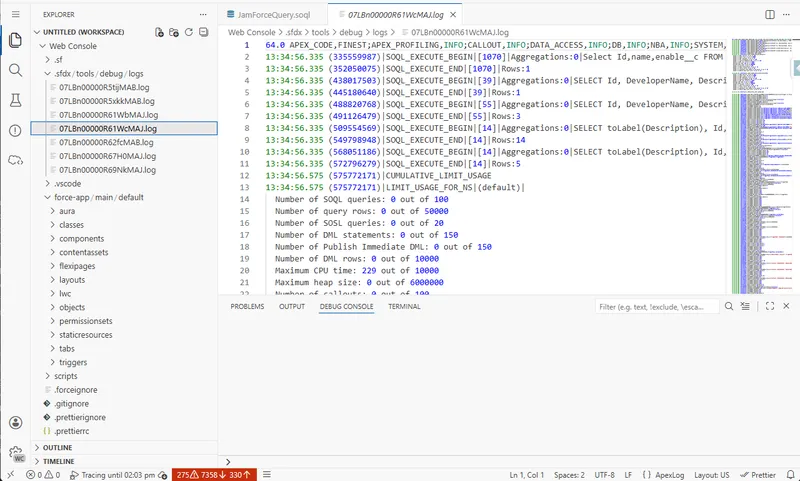
-
SOQL execution and Query Plan Inspector
You can run SOQL queries from within Web Console and view results in a formatted grid, with the option to inspect query performance using Query Plan to understand index usage and cost. For deeper query tuning, see SOQL performance optimisation techniques. For filter design, advanced filtering patterns is the better companion guide.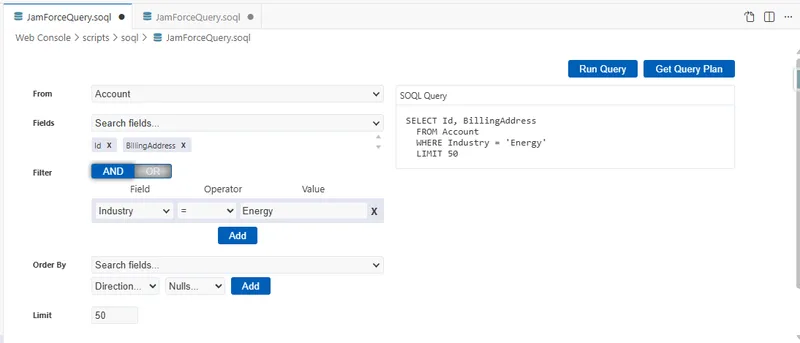
-
Anonymous Apex execution
Web Console lets you run Anonymous Apex scripts without creating a class, which is ideal for one-off checks, data fixes, or probing a method’s behaviour with real org data. For background on execution behaviour, see asynchronous Apex fundamentals. For release discipline around quick fixes, testing and deployment practices provides the right guardrails.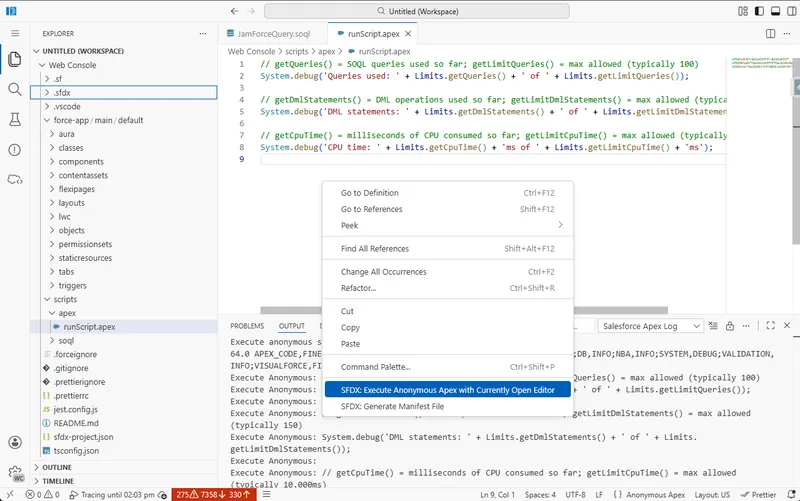
-
Quick Apex edits
In supported non-production orgs, you can open Apex classes and triggers from context (for example, from Setup pages) and make focused inline edits to address a specific defect or tweak behaviour. -
Org-aware navigation
Web Console is org-aware: you can navigate metadata in an integrated browser so that Apex, queries, and configuration live in the same place you’re already working, rather than in an external project. -
Modern, VS Code–style UI
The interface is modelled on a lightweight VS Code-in-the-browser experience, with an activity bar, side panels, editors, and output panels that feel familiar to developers while remaining approachable for admins.
These features are intentionally scoped to high-frequency investigative tasks: understanding a failure, tracing it to source, checking query behaviour, making a targeted fix, and validating the outcome.
🛡️ Environment Guardrails: Balancing Power and Safety
Section titled “🛡️ Environment Guardrails: Balancing Power and Safety”Web Console is designed to make developers faster without weakening Salesforce’s long-standing safety model for production. Salesforce retains the core guardrail that Apex and similar protected metadata cannot be edited directly in production, even from this new IDE.
| Environment | Apex Editing Capability | Rationale |
|---|---|---|
| Production orgs | Read-only | Developers can inspect and understand production code and logs safely, but must still use governed deployment mechanisms (for example, change sets, Metadata API, or CI/CD) to change Apex. |
| Non-production orgs (sandboxes, developer orgs, scratch orgs) | Full inline editing and saving (within supported types) | Developers can make targeted edits to Apex and related metadata directly in Web Console to speed up debugging and testing in isolated environments. |
This balance preserves the integrity of live systems while still giving teams the speed they want when working in lower environments. It also lines up with the deployment discipline covered in sandbox strategy and change management. For the developer side of that workflow, see Salesforce testing and deployment fundamentals.
⚙️ Enabling Web Console (Beta)
Section titled “⚙️ Enabling Web Console (Beta)”Web Console (Beta) is off by default and must be explicitly enabled by an administrator, which gives each org control over when and how to adopt it. During open beta, enablement is a simple org-level setting:
- Log in as a system administrator (or a user with equivalent Setup access).
- In Setup, search for Web Console (Beta) in the Quick Find box.
- Open the Web Console (Beta) setup page and toggle the feature to Active.
- Refresh the Salesforce UI; Web Console (Beta) will appear in the gear menu alongside options like Developer Console.
Once enabled, Web Console respects existing permissions: it does not grant access to metadata, logs, or data that a user could not already reach through the normal Salesforce UI.
For the official setup and usage guidance, see the Salesforce Web Console documentation.
🚀 Launching Web Console in Context
Section titled “🚀 Launching Web Console in Context”After Web Console is enabled, there are several entry points, each reinforcing the “in-context” philosophy.
-
From the gear icon
From most Salesforce pages, you can open Web Console directly via the gear icon → Web Console (Beta), which launches the IDE in a new tab or browser window. -
From Setup pages
On context-rich pages like Apex Jobs, Apex Classes, or Apex Triggers, you can open the relevant code directly in Web Console, skipping the manual step of locating the file by name. -
Fallback to Developer Console
In orgs where Web Console is not enabled, these entry points fall back to legacy tools like Developer Console, preserving existing workflows until the org is ready to opt in.
This design ensures that the IDE meets the developer where the problem is already visible, instead of forcing them to reconstruct the scenario in a separate tool.
🔍 A Practical Example: Debugging an Apex Job Failure
Section titled “🔍 A Practical Example: Debugging an Apex Job Failure”Apex job failures are a flagship scenario Salesforce uses to illustrate the value of Web Console. Imagine a batch job failing in a sandbox:
- A developer starts on the Apex Jobs page in Setup, where the failed job is listed with its error message.
- From there, they open the related Apex class in Web Console (Beta), landing directly in the code that drives the job.
- Inside Web Console, they enable logging for their user so that the next run produces detailed debug logs.
- They re-run the scenario, then open the latest log in Web Console to inspect the execution path and jump from the stack trace to the exact line of code causing the failure.
- They apply a focused fix in the inline editor, save it back to the sandbox, execute tests or rerun the job, and confirm that it completes successfully, all without leaving the browser.
This flow mirrors how real troubleshooting happens: work begins at the point of failure, and Web Console stays with the developer from diagnosis through validation.
⚖️ Pros and Cons of the Salesforce Web Console (Beta)
Section titled “⚖️ Pros and Cons of the Salesforce Web Console (Beta)”Understanding where Web Console shines and where it is intentionally limited, helps teams decide how to fit it into their toolchain.
| Advantage | Description |
|---|---|
| Speed and efficiency | Launches quickly in the browser with no local setup, ideal for high pressure debugging or working from machines without a preconfigured dev environment. |
| Modern user interface | Provides a VS Code style, panel-based UI that feels more modern and responsive than the legacy Developer Console. |
| Zero setup | Requires only a browser and Salesforce login, no CLI installation, extensions, or extra authentication workflow. |
| In-context debugging | Keeps runtime evidence (logs), source code, and validation actions together, reducing context switching and cognitive overhead. |
| Built-in safety | Maintains read-only behaviour for Apex in production while enabling full editing in non-production orgs, aligning with Salesforce’s deployment discipline and change management best practices. |