SOQL Performance Optimisation: Enhancing Query Efficiency

A query that runs instantly in a sandbox can time out in production, and usually nothing about the query changed. What changed is the data underneath it. Filters that looked narrow when the object held 50,000 records stop being narrow at 5 million, the optimiser abandons the index it was using, and a page that always loaded in under a second starts throwing timeouts during the busiest hour of the day.
On a large object, the first thing to check is selectivity: whether your filter narrows the search enough for Salesforce to jump straight to the matching records using an index, rather than reading through the whole object to find them.
An index works like the index at the back of a book. Looking up a term that appears on two pages is quick. Looking up one that appears on almost every page is not, and past a certain point it is faster to just read the book. Salesforce weighs it up the same way, and it decides using the data sitting in your org today, not the way the query is written. That is why a query nobody has touched can slow down on its own: the data grew around it.
This guide covers how to tell whether a filter is selective, how to read the Query Plan tool rather than guess, what indexes Salesforce gives you and what you have to request, and how to structure a query so it stays fast as the org grows. If you want a refresher first, review filtering with the WHERE clause, querying object relationships, and integrating SOQL with Apex.
🎯 Write selective filters
Section titled “🎯 Write selective filters”Selectivity is worth checking first, but it is not the whole story. When the optimiser can lead with a selective index, it starts from a smaller set of candidate rows instead of scanning broadly. That does not guarantee a fast query: the fields selected, relationship traversal, sorting, sharing, and final result volume still add work. It does tell you whether the access path is a likely bottleneck.
A filter is selective when it narrows the candidate records below the optimiser’s threshold for the index available on that field. There is no universal “under 10 percent” rule: the threshold depends on the index type, and the record counts it applies to are absolute as well as proportional.
📏 Selectivity thresholds
Section titled “📏 Selectivity thresholds”| Standard index | Custom index | |
|---|---|---|
| Threshold, first million targeted records | 30% | 10% |
| Threshold, records beyond the first million | 15% | 5% |
| Absolute cap on targeted records | 1,000,000 | 333,333 |
Two things to take from this table. Custom indexes are held to a stricter standard than standard ones, so adding a custom index to a field does not guarantee the optimiser will use it. And the absolute caps only come into play on genuinely large objects: you need roughly 5.6 million records before the percentage threshold produces a targeted count high enough to hit the cap.
Treat these as the current documented thresholds rather than a permanent contract. Salesforce states that optimiser behaviour can change, and data skew, unsupported operators, and deleted records still awaiting physical deletion can all produce a plan the percentages alone would not predict. The Query Plan tool is the test, not the arithmetic.
🚫 What stops the optimiser using an index
Section titled “🚫 What stops the optimiser using an index”An indexed field only helps when the filter uses an operation the index can serve. Salesforce documents several cases where a query gives up its index without the author realising:
- Empty values. Index tables do not include null records by default, so a filter looking for records with nothing in a field has no index rows to read.
ORacross mixed fields. Every field in anORclause must be indexed before any index is used. One unindexed branch is enough to lose the whole condition.LIKEcomparisons. The optimiser skips its statistics table forLIKEand instead samples up to 100,000 actual records to decide whether the custom index is worth using. A pattern that matches a large share of that sample will not get the index, which is the usual fate of a leading wildcard such asLIKE '%Ltd'.
One more is worth knowing even though Salesforce does not document it as a rule: negative operators (!=, NOT IN) tend to be poor candidates, because asking the database to prove absence generally means inspecting everything. Treat that as a prompt to check the plan rather than a guarantee, and see advanced filtering techniques for the operator syntax itself.
Start with the records the business actually needs. If the requirement is “all open Opportunities”, WHERE IsClosed = false states that directly; excluding a single StageName does not, because an org can have more than one closed stage. Treat that rewrite as a correctness improvement, not an index strategy.
For performance, add a selective indexed filter such as OwnerId or CreatedDate only when it also belongs in the requirement, then verify the combined query in Query Plan. Apply the same rule to NOT IN: use an IN allowlist when you know the exact values you want, but check the plan rather than assuming the positive form must be faster.
🧭 Read the query plan
Section titled “🧭 Read the query plan”The section above keeps telling you to check the plan. This is how, and why it beats guessing.
The Query Plan tool shows every route Salesforce considered for your query, what each one would cost, and which it chose. That answers the question teams argue about longest: is this query slow because Salesforce is working too hard to find the records, or because there are simply a lot of records to return? The two have different fixes, and only the first is solved by an index.
🔧 Enable the Query Plan tool
Section titled “🔧 Enable the Query Plan tool”-
Open the Developer Console from the setup gear menu, then choose Help | Preferences.
-
Set “Enable Query Plan” to
TRUE. The preference is per user, so each developer enables it on their own login. -
Open the Query Editor tab at the bottom of the console. A Query Plan button should now sit beside Execute. If it is missing, the preference did not save: reopen Preferences and confirm it still reads
TRUE. -
Paste a query and press Query Plan rather than Execute. You should see one row for each plan Salesforce considered, each with its own cost.
📊 Interpret the results
Section titled “📊 Interpret the results”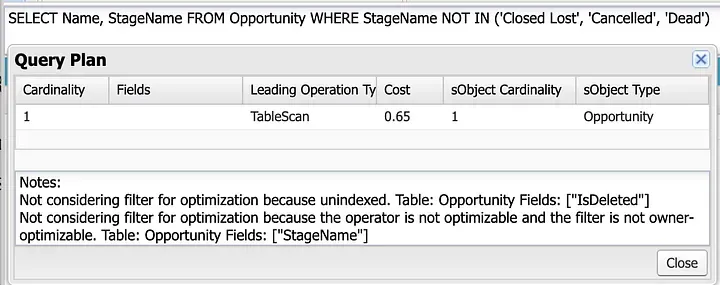
| Column | What it tells you | What to look for |
|---|---|---|
| Leading Operation Type | How Salesforce first narrows the records: Index uses a field index, Sharing uses the running user’s record access, TableScan scans the object, and Other uses another internal optimisation | Prefer the lowest-cost suitable plan. Index and Sharing can both be efficient; inspect the cost and notes for Other, and investigate a TableScan on a large object when the query should be selective |
| Cost | The plan’s cost relative to the selectivity threshold | At or above 1, the query is not selective. Compare plans against each other, do not read it as elapsed time |
| Cardinality | Estimated records the leading operation returns | Smaller is better; this is the number driving selectivity |
| sObject Cardinality | Approximate total records in the object | The denominator. Context for whether the cardinality above is actually narrow |
| Fields | The indexed fields used | Populated only when the leading operation is Index, and null otherwise |
Salesforce runs the plan with the lowest cost. That is worth remembering, because a TableScan is sometimes the correct answer: for a deliberately broad query against a small object, scanning really is cheaper than walking an index. Tighten the business scope when the query should have been narrow. Do not chase an index purely to make the words TableScan disappear.
📁 Use the right indexes
Section titled “📁 Use the right indexes”Salesforce indexes a set of fields automatically, including the record ID, Name, RecordTypeId, CreatedDate, SystemModstamp, Email on Contact and Lead, and foreign keys such as lookup and master-detail fields. The exact set varies by object. Beyond those, you have three options, and they escalate in effort.
Index an eligible custom field yourself by marking it Unique or External ID. This is the cheapest route and it covers most cases where a custom field has become a primary filter.
Request a custom index from Salesforce Support for a proven query pattern that the self-service options do not cover. Bring the query and its Query Plan output; “this field feels important” is not a case.
Escalate to large-data-volume tooling when even indexed queries strain. A two-column (composite) index can be more selective than either field alone when a query always filters on both. Skinny tables store a supported subset of frequently used fields in a narrower table, reducing joins and the amount of data scanned for eligible read operations. Both are created by Salesforce Support after reviewing the query rather than configured directly.
Whichever route you take, keep the SELECT list to the fields the caller actually consumes. Wide queries cost more to assemble and transfer even when the leading operation is a clean index hit, and they are the easiest thing to trim.
🧱 Structure the query itself
Section titled “🧱 Structure the query itself”A selective filter does not finish the job. The rest of the query still determines how much work Salesforce performs after it finds the candidate rows.
Pair LIMIT with a deterministic ORDER BY for top-N and interactive views, so results are stable between runs. OFFSET is fine for shallow pagination and is capped at 2,000, so anything deeper needs a query locator or keyset pagination (WHERE Id > :lastId ORDER BY Id). The ordering and limiting guide covers the pagination trade-offs in detail.
Keep joins and subqueries to what the use case needs. Each additional relationship level gives the optimiser more work and more opportunity to pick a plan you did not expect, and deeply nested queries are harder to diagnose when they do go wrong.
🧪 Worked example: tightening a high-volume case queue
Section titled “🧪 Worked example: tightening a high-volume case queue”A support queue backed by Apex started timing out during peak hours. The original query filtered on a broad status value and sorted a large result set:
SELECT Id, Subject, Status, Priority, CreatedDateFROM CaseWHERE Status != 'Closed'ORDER BY CreatedDate DESCLIMIT 200Two things worked against it. The negative filter (!= 'Closed') is not an indexable operation, and nothing limits the query to the support queue or a recent working window. The optimiser can be left examining and sorting a broad Case population before LIMIT reduces the returned rows.
Assume the page is for one support queue, shows only open high- or medium-priority Cases created in the past 30 days, and uses the queue’s Id in supportQueueId. A rewrite can now add positive, indexed candidates without changing that agreed scope:
SELECT Id, Subject, Status, Priority, CreatedDateFROM CaseWHERE OwnerId = :supportQueueIdAND CreatedDate = LAST_N_DAYS:30AND IsClosed = falseAND Priority IN ('High', 'Medium')ORDER BY CreatedDate DESC, Id DESCLIMIT 200There are a few deliberate choices in this version:
OwnerIdandCreatedDateare standard indexed fields, so either can be considered as the leading filter when its values fall below the relevant threshold.IsClosed = falsemeans every Case status configured as open. That is not necessarily equivalent toStatus != 'Closed'in an org with several closed status values, and it is included for business correctness rather than assumed index use.Priorityis added because the queue genuinely does not need low-priority Cases, not simply to make the numbers smaller. A filter that narrows the query but changes what the business sees is a bug, not an optimisation.Idbreaks ties between Cases created at the same time, giving the limited result a stable order.
To confirm the rewrite worked, check Query Plan against production-like data. Confirm whether OwnerId, CreatedDate, or another indexed field drives the cheapest plan, compare its cardinality and cost with the original, and then measure page load under realistic concurrency. If the plan remains a TableScan, narrow the legitimate business scope or investigate an appropriate index rather than assuming this example must be selective in every org.
📈 Monitor before it breaks
Section titled “📈 Monitor before it breaks”Query performance degrades quietly. Nobody files a ticket when a page gets half a second slower, so the first signal is usually a timeout that has been building for months.
Track timeouts and slow endpoints in whatever monitoring your team already uses, and investigate repeated database-time contributors with tools such as Scale Center where it is available to you. The specific moments worth a deliberate recheck are after a large data load, after a migration that changes record distribution, and after any release that adds a filter to an existing high-traffic query.
✅ Conclusion
Section titled “✅ Conclusion”Optimising SOQL comes down to one habit: trust the plan you observe against production-like data, not the index label on the field. A field being indexed does not mean your filter is selective, a custom index does not guarantee the optimiser will use it, and a TableScan is not automatically wrong. The Query Plan tool settles all three questions in a few seconds, and it is the difference between fixing a query and rearranging it.
The next stop on the advanced learning path is Security and SOQL: a fast query still has to respect who is allowed to see the rows it returns.